Debugging Upload Scripts in Other Platforms
This topic describes different approaches to solving the issue when Image Uploader is unable to successfully upload files and displays the following error message:
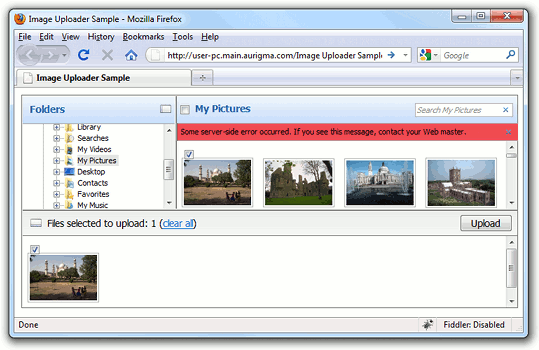
As well, sometimes you may see the message saying that upload is successful, but files appear to be not uploaded; this may indicate a server error but not necessarily.
In this case, please, firstly check that you specified at least one converter, your upload script really saves files, and you are looking for files in the correct folder.
Here are the most probable issues causing the server-side error:
- Image Uploader cannot save uploaded files because of wrong permissions configuration. See the Installation and Deployment Notes topic to learn how to set required permissions.
- The request size is too big. See your web server documentation to get to know how to increase maximum request length.
- There is an error in your upload script (specified with the uploadSettings.actionUrl property). See the debug approaches described below to find the error.
If you experience an issue having different sympthoms than those described in this article, please, see the Basic Steps in Troubleshooting topic.
Here we consider the following approaches to handling and debugging server-side errors:
- Event handling approach implies showing the server response when some error occurs. If displaying errors is enabled, this response contains error details. However, this approach requires some modifications of Image Uploader settings.
- Using sniffer allows you to view server response without necessity to modify embedding code, but it uses a third-party tool.
- Using debug console allows you to view errors, debug messages from Image Uploader, and information messages.
Event Handling
If you are not familiar with the client events in Image Uploader, please, read the Using JavaScript API topic first.
Image Uploader provides two events which are helpful for debugging, namely, Error and AfterUpload. The first one fires when a server or client-side error occurs, and the second fires when an upload is supposed to be successful. We recommend to handle both events simultaneously to get debug information on server errors.
The Error event provides detailed description of an occurred error through the errorPage parameter
which represents the web page returned from the server. To ignore non-server errors you can use the errorCode argument, since it is equal
to 4 in case of internal server error. For the full list of error codes, please, see the Error event parameters paragraph.
The idea of catching errors via the AfterUpload event is as follows:
- Make your upload script to return some predefined response after all the uploaded files were saved.
- In the AfterUpload event handler check whether a string returned by the response parameter contains the predefined one.
- If this check has failed, then an error has occurred and the response parameter contains the error-related information.
Let us presume that server-side upload script returns a "complete" string (predefined response) after all the uploaded files were saved, then
the following code will show error details if a server-side error occurs.
<script type="text/javascript" src="Scripts/aurigma.uploader.js">  </script>
<script type="text/javascript">
function showErrorWindow(errorMessage){
	var newWindow = window.open();
	with (newWindow.document) {
		open("text/html");
		write("A server error occured<br/>");
		write("Error Message: " + errorMessage);
		close();
	}
}

function errorHandler(errorCode, httpResponseCode, errorPage, additionalInfo){
	//Occured error is a server error
	if (errorCode == 4) {
		showErrorWindow(errorPage);
	}
}

function afterUploadHandler(response){
	//Some server-side error occurred
	if (response.indexOf("complete") > -1){
		showErrorWindow(response);
	}
}

	var u = $au.uploader({
		id: 'Uploader1',
		events: { afterUpload: afterUploadHandler,
			error: errorHandler}
	});
	u.writeHtml();
</script>
Using Sniffer
As an example of network analyzer tool we use the Fiddler. Here we discuss how to use it to debug server-side upload script.
- Open your application in browser. If it is able to send traffic to Fiddler, the corresponded session will be displayed in the Web Sessions pane of the tool.
- Send a file via Image Uploader.
-
Double-click the session with server error in the Web Sessions pane.
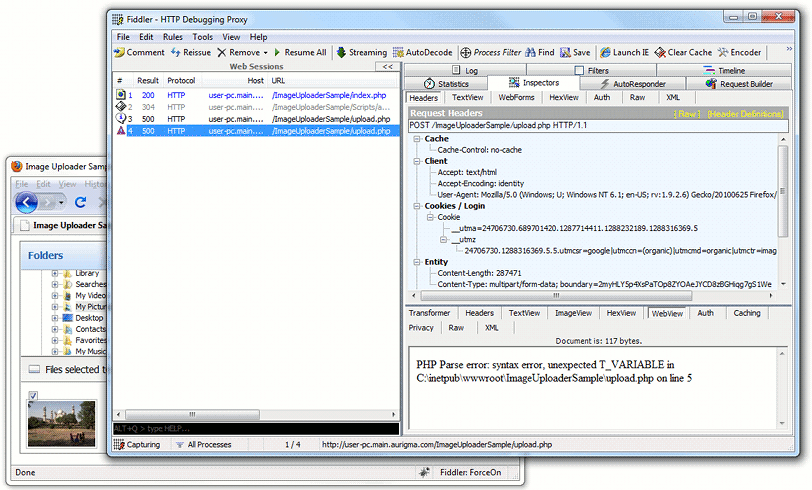
Find upload session details in the left part of Fiddler's interface. Here it contains the POST request sent by Image Uploader and the response returned by your upload script. If your upload script contains an error this error details will be displayed in the returned response.
Using Debug Console
You can use the debug class and the error console of browser to view Image Uploader error and warning messages along with the response returned by your upload script.
In order to do it you should, firstly, insert the following code before rendering Image Uploader:
<script type="text/javascript">
    $au.debug().level(3);
    $au.debug().mode(['popup','console']);
</script>
Secondly, open the console. Here are the ways to open the console in the most popular browsers:
- In Internet Explorer 8 open Tools -> Developer Tools (or press F12), then select Script tab in the left pane and click Console in the right pane.
- In Mozilla Firefox we recommend to use Firebug.
- In Google Chrome click the Wrench icon and select Tools -> JavaScript Console (or press Ctrl+Shift+J).
- In Safari turn on the Develop menu in the Advanced pane of Safari Preferences, after that go to Develop -> Show Error Console (or press Cmd+Alt+C).
If your browser has no error console, please, allow pop-up windows in your browser.
For more information about the debug class, please, see the Using JavaScript API topic.